
Steema Software
23 Case Studies
A Steema Software Case Study
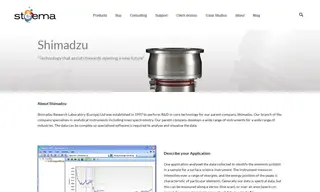
Steema Software provided its charting components to Shimadzu Research Laboratory (Europe) Ltd, which required specialized software to analyze and visualize complex spectral data from its analytical instruments. The challenge was to create an application capable of representing different types of data, including raw and smooth spectral data, peak positions for various elements, and lines for element identification, all while handling large datasets from line scans and area images.
The solution was implemented using TeeChart for C++ and later TeeChart for .NET, which offered the necessary flexibility and a wide range of built-in properties. Shimadzu built wrapper functions around the component to create a reusable user interface class, enabling them to control multiple charts across projects. The benefits from using Steema Software's TeeChart included significant savings in development time through reusability, the easy ability to display different spectra on a single chart for comparison, and powerful zoom, pan, and cursor selection tools for both 1D and 2D data analysis.
Jennifer Broughton
Research Software Engineer & Data Analyst
23 Case Studies