

Preset
33 Case Studies
A Preset Case Study
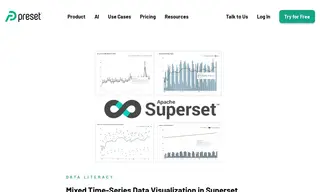
The customer, the Superset core contributors, faced a challenge in effectively comparing different time-series metrics. They needed a way to visualize and contrast data sets like daily active users against total users within a single, cohesive chart to uncover deeper insights, a task that was cumbersome with separate, side-by-side graphs. To address this, they utilized the mixed time-series visualization feature within Preset's Superset platform.
Preset's solution enabled the creation of a mixed time-series chart that combines two visualizations, such as a line graph and a bar chart, in a single container with a shared axis. This allowed for immediate and clear comparisons, such as tracking engagement trends over an expanded three-month period without losing clarity. The implementation facilitated easier identification of patterns and rhythms, empowering users to perform more sophisticated analyses like comparing rolling means, ultimately leading to more actionable data insights.
Superset Core Contributors
33 Case Studies