

Pentagram
1049 Case Studies
A Pentagram Case Study
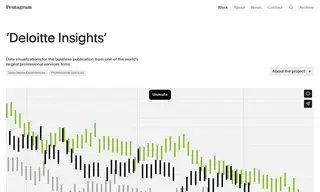
The customer Deloitte required a unique data visualization strategy for its 'Deloitte Insights' publication to differentiate itself from competitors like Harvard Business Review. The challenge was to modernize its graphs and charts to appear less academic while retaining their authority and precision. The vendor Pentagram was engaged to overhaul this essential brand element.
Pentagram implemented a comprehensive data visualization system inspired by Deloitte's heritage, featuring a bold grid system and a restrained color palette that incorporated the firm's iconic green dot. The solution included designing over 20 custom chart templates and a bespoke handwriting typeface for annotations. As a result, Pentagram helped reposition Deloitte Insights as a contemporary yet rigorous resource, providing extensive guidelines to ensure the design language could be consistently applied by the client's staff.
1049 Case Studies